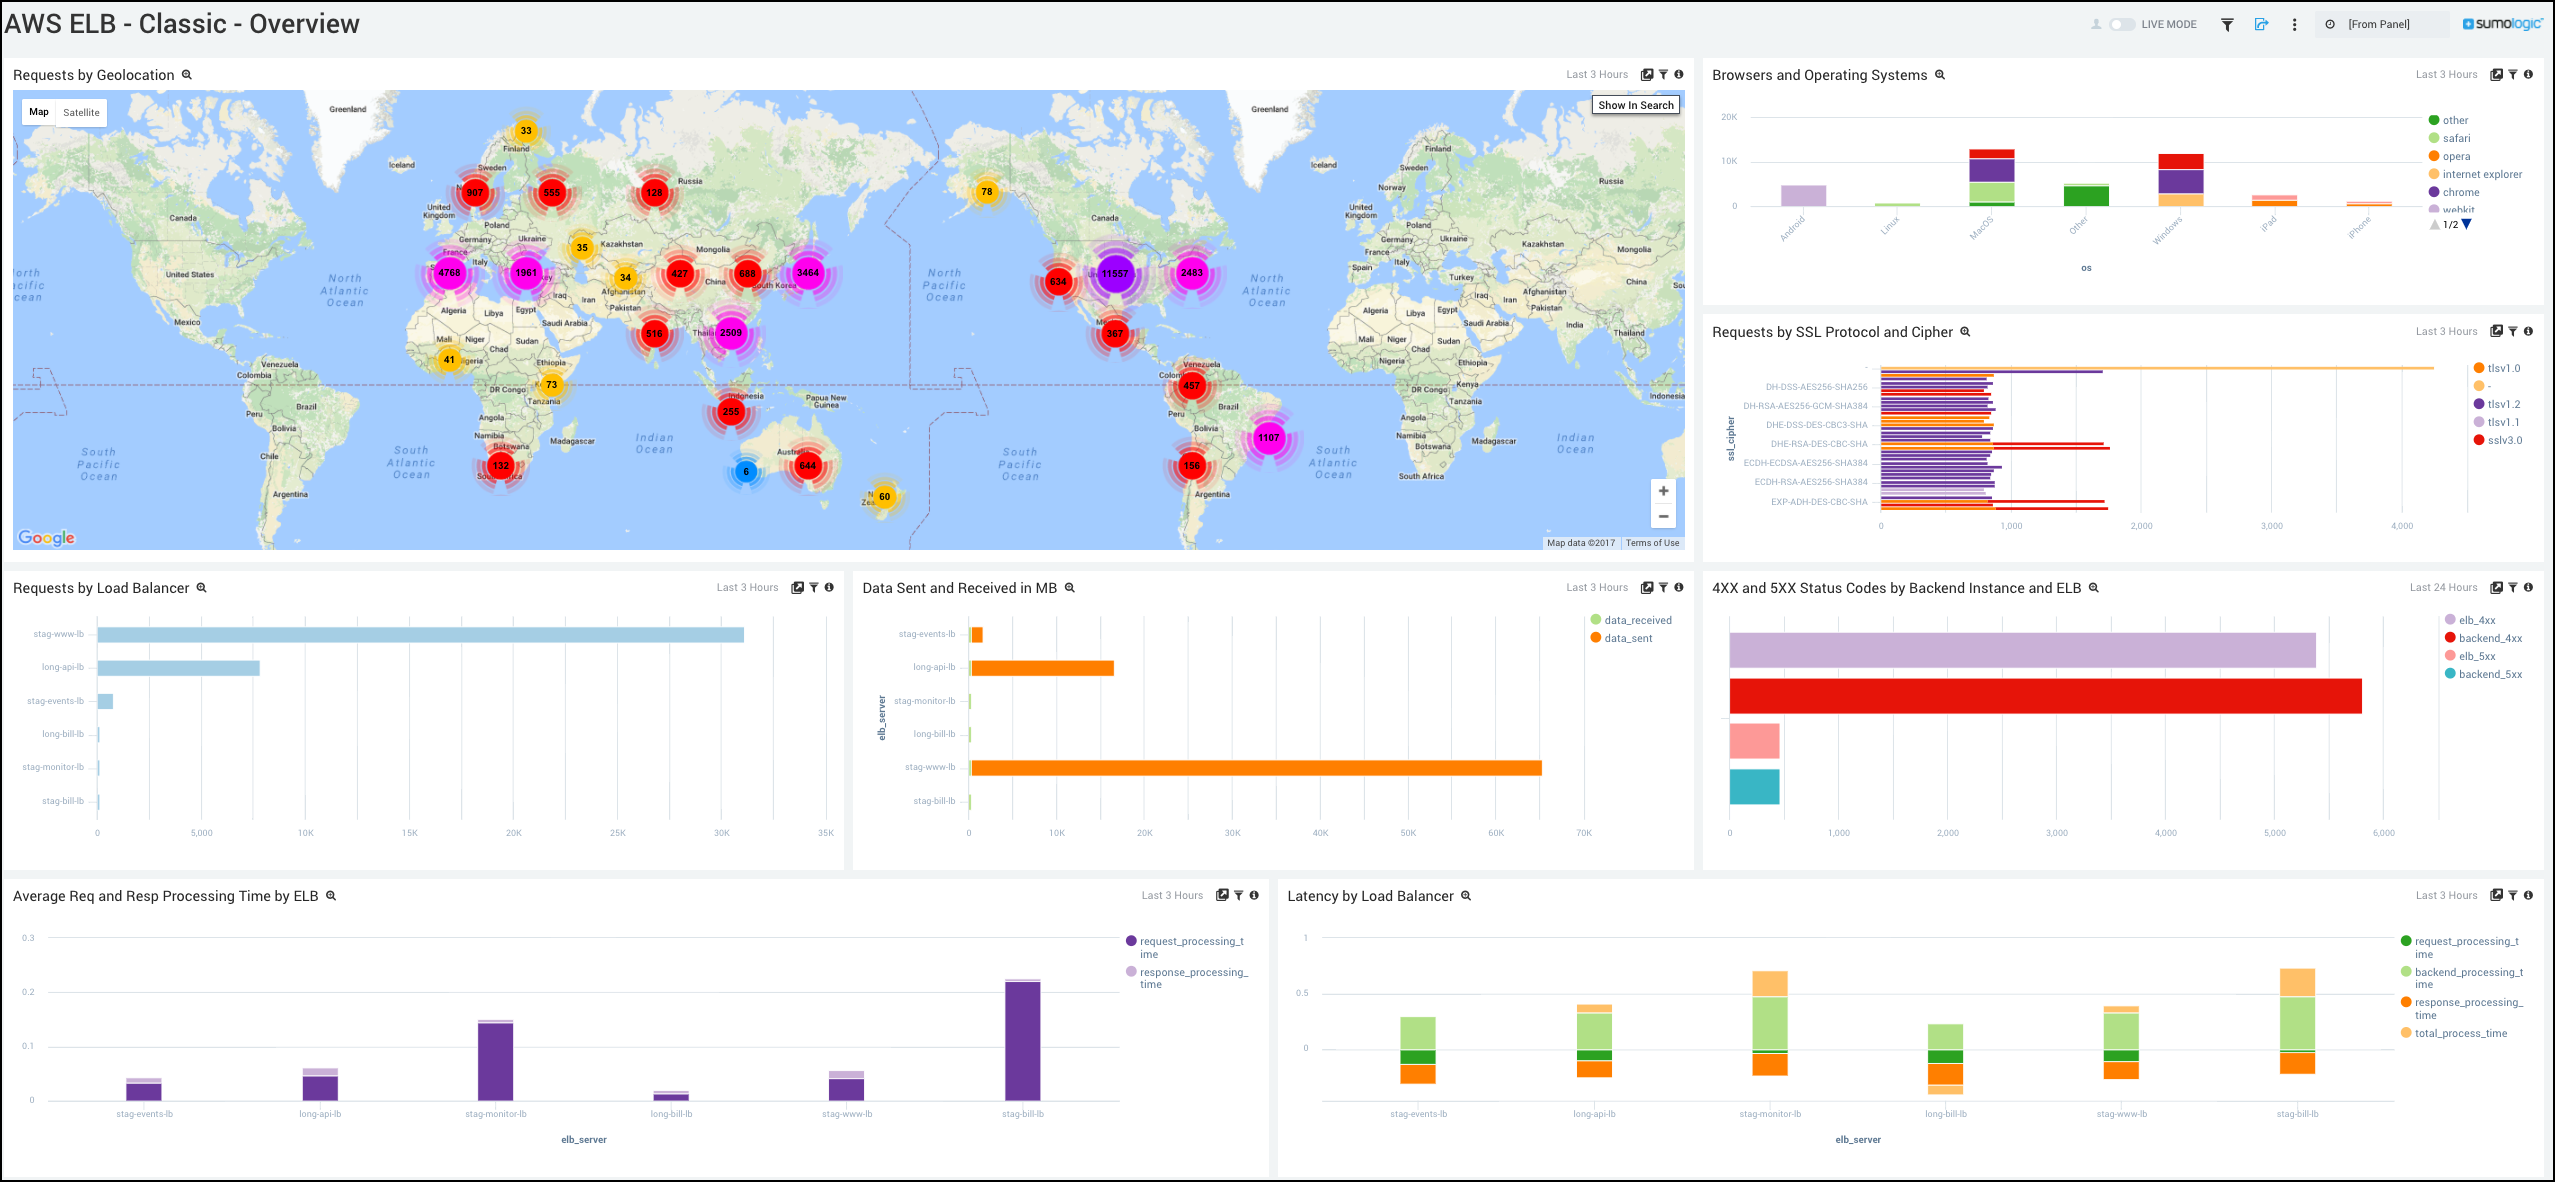
Quick Refresher
Earlier this year, we showed you how to monitor Amazon Web Services Elastic Load Balancer (AWS ELB) with Cloudwatch. This piece is a follow up to that, and will focus on Classic Load Balancers. Classic Load Balancers provide basic load balancing across multiple Amazon EC2 instances and operate at both the request level and connection level. Classic Load Balancers are intended for applications that were built within the EC2-Classic network. AWS provides the ability to monitor your ELB configuration with detailed logs of all the requests made to your load balancers. There is a wealth of data in the logs generated by ELB, and it is extremely simple to set up.
How to Get Started: Setting up AWS ELB Logs
Logging is not enabled in AWS ELB by default. It is important to set up logging when you start using the service so you don’t miss any important details!

Step 1: Create an S3 Bucket and Enable ELB Logging
Note: If you have more than one AWS account (such as ops, dev, and so on) or multiple regions that generate Elastic Load Balancing data, you’ll probably need to configure each of these separately.
Here are the key steps you need to follow
- Create an S3 Bucket to store the logs
Note: Want to learn more about S3? Look no further (link)
- Allow AWS ELB access to the S3 Bucket
- Enable AWS ELB Logging in the AWS Console
- Verify that it is working
Step 2: Allow Access to external Log Management Tools
To add AWS ELB logs to your log management strategy, you need to give access to your log management tool! The easiest way to do that is by creating a special user and policy.
- Create a user in AWS Identity and Access Management (IAM) with Programmatic Access. For more information about this, refer to the appropriate section of the AWS User Guide.
Note: Make sure to store the Access Key ID and Secret Access Key credentials in a secure location. You will need to provide these later to provide access to your tools!
- Create a Custom Policy for the new IAM user. We recommend you use the following JSON policy:
{
“Version”:”2012-10-17″,
“Statement”:[
{
“Action”:[
“s3:GetObject”,
“s3:GetObjectVersion”,
“s3:ListBucketVersions”,
“s3:ListBucket”
],
“Effect”:”Allow”,
“Resource”:[
“arn:aws:s3:::your_bucketname/*”,
“arn:aws:s3:::your_bucketname”
]
}
]
}
Note: All of the Action parameters shown above are required. Replace the “your_bucketname” placeholders in the Resource section of the JSON policy with your actual S3 bucket name.
Refer to the Access Policies section of the AWS User Guide for more info.
What do the Logs look like?
ELB logs are stored as .log files in the S3 buckets you specify when you enable logging.
The file names of the access logs use the following format:
bucket[/prefix]/AWSLogs/aws-account-id/elasticloadbalancing/region/yyyy/mm/dd/aws-account-id_elasticloadbalancing_region_load-balancer-name_end-time_ip-address_random-string.log
bucket
The name of the S3 bucket.
prefix
The prefix (logical hierarchy) in the bucket. If you don’t specify a prefix, the logs are placed at the root level of the bucket.
aws-account-id
The AWS account ID of the owner.
region
The region for your load balancer and S3 bucket.
yyyy/mm/dd
The date that the log was delivered.
load-balancer-name
The name of the load balancer.
end-time
The date and time that the logging interval ended. For example, an end time of 20140215T2340Z contains entries for requests made between 23:35 and 23:40 if the publishing interval is 5 minutes.
ip-address
The IP address of the load balancer node that handled the request. For an internal load balancer, this is a private IP address.
random-string
A system-generated random string.
The following is an example log file name:
s3://my-loadbalancer-logs/my-app/AWSLogs/123456789012/elasticloadbalancing/us-west-2/2014/02/15/123456789012_elasticloadbalancing_us-west-2_my-loadbalancer_20140215T2340Z_172.160.001.192_20sg8hgm.log
Syntax
Each log entry contains the details of a single request made to the load balancer. All fields in the log entry are delimited by spaces. Each entry in the log file has the following format:
timestamp elb client:port backend:port request_processing_time backend_processing_time response_processing_time elb_status_code backend_status_code received_bytes sent_bytes “request” “user_agent” ssl_cipher ssl_protocol
The following table explains the different fields in the log file. Note: ELB can process HTTP requests and TCP requests, and the differences are noted below:
| Field | Description |
| timestamp | The time when the load balancer received the request from the client, in ISO 8601 format. |
| elb | The name of the load balancer |
| client:port | The IP address and port of the requesting client. |
| backend:port | The IP address and port of the registered instance that processed this request. |
| request_processing_time | [HTTP listener] The total time elapsed, in seconds, from the time the load balancer received the request until the time it sent it to a registered instance. |


