Sumo Logic makes it easy to aggregate and search terabytes of log data. But you don’t always have terabytes of data on 1000s of servers. Sometimes you have just a few log files on a single server. We’re open sourcing Sumoshell, a set of tools recently created at a hackathon, to help fill that gap.
Getting real value from your logs requires more than finding log lines that match a few keywords and paging through (ala tail/grep/less) — you need parsing, transforming, aggregating, graphing, clustering (and more). All these things are easy to do in Sumo Logic, but they’re hard to do with the standard set of unix command line utilities people usually use to analyze logs. Sumoshell is a set of command line utilities to analyze logs. Its goal is to bring Sumo Logic’s log analysis power to the command line.
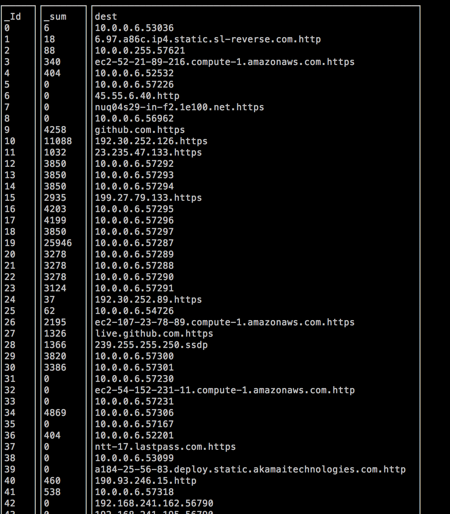
Here’s an example of Sumoshell parsing tcpdump’s output to show the ip addresses that my laptop is sending data to, and the total amount of data sent to each host. The TCP dump looks like this:
23:25:17.237834 IP 6.97.a86c.com.http > 10.0.0.6.53036: Flags [P.], seq 33007:33409, ack 24989, win 126, options [TS], length 2
23:25:17.237881 IP 10.0.0.6.53036 > 6.97.a86c.com.http: Flags [.], ack 2, win 4096, options [nop], length 0
23:25:17.237959 IP 10.0.0.6.53036 > 6.97.a86c.http: Flags [P.] options [nop,nop,TS val 1255619794 ecr 249923103], length 6
The Sumoshell command is:
sudo tcpdump 2>/dev/null | sumo search | sumo parse "IP * > *:" as src, dest | sumo parse "length *" as length | sumo sum length by dest | render
The Sumoshelll query language supports an adapted subset of the Sumo Logic query language, utilizing Unix pipes to shuttle data between operators.
The output is:
Some other helpful features of Sumoshell:
- Sumoshell understands that multiline log messages are one semantic unit, so if you search for Exception, you get the entire stack trace.
- Sumoshell lets you parse out pieces of your logs to just print the bits you care about or to use later in aggregations or transformations. Once you’ve parsed out fields like
status_codeorresponse_time_ms, you can count bystatus_codeoraverage response_time_ms by status_code. If you wanted to do this for your weblogs, you could do something like:
tail -f /var/log/webserver/http.log | sumo search "GET" | sumo parse "[status=*][response_time=*] as stat, rt | average rt by stat | render
- Once you’ve parsed fields, or aggregated the results with sum, count, or average, Sumoshell comes with intelligent pretty-printers to clearly display the aggregate data on the command line. They know how wide your terminal is so text won’t wrap and be hard to read. They figure out how many characters individual fields have, so the columns line up. They even let you see live updating graphs of your data, all in your terminal.
You can learn more about Sumoshell at the Github repository where you can also download binaries, see the source, and contribute your own operators.
If Sumoshell helps you analyze logs on one server, consider trying out Sumo Logic to use even more powerful tools on your entire fleet.


